
Page 414 - Vseživljenjsko učenje kot temelj trajnostne družbe
P. 414
Marina Semiz
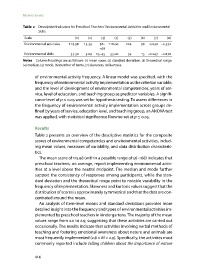
Table 2 Descriptive Indicators for Preschool Teachers’ Environmental Activities and Environmental
Skills
Scale () () () () () () () ()
Environmental activities . . – . . –.
Environmental skills . . – . –. –.
Notes Column headings are as follows: (1) mean score, (2) standard deviation, (3) theoretical range,
(4) median, (5) mode, (6) number of items, (7) skewness, (8) kurtosis.
of environmental activity frequency. A linear model was specified, with the
frequencyofenvironmentalactivityimplementationasthecriterionvariable,
and the level of development of environmental competencies, years of ser-
vice, level of education, and teaching group as predictor variables. A signifi-
cance level of p ≤ 0.05 was set for hypothesis testing. To assess differences in
the frequency of environmental activity implementation across groups de-
fined by years of service, education level, and teaching group, an ANOVA test
was applied, with statistical significance likewise set at p ≤ 0.05.
Results
Table 2 presents an overview of the descriptive statistics for the composite
scores of environmental competencies and environmental activities, includ-
ing mean values, measures of variability, and data distribution characteris-
tics.
The mean score of 115.98 (within a possible range of 56–168) indicates that
preschool teachers, on average, report implementing environmental activ-
ities at a level above the neutral midpoint. The median and mode further
support the consistency of responses among participants, while the stan-
dard deviation and the theoretical range point to notable variability in the
frequency of implementation. Skewness and kurtosis values suggest that the
distribution ofscoresisapproximatelysymmetricalandthat thedataarecon-
centrated around the mean.
An analysis of item-level means and standard deviations provides more
detailed insight into the frequency and types of environmental activities im-
plemented by preschool teachers in kindergartens. The majority of the mean
values range from 2.0 to 2.9, suggesting that these activities are carried out
occasionally. The results indicate that activities involving verbal methods of
teaching and fostering emotional awareness about nature and animals are
most frequently implemented (2.8 < M < 2.9). Specifically, the activities most
commonly reported include telling children about the importance of nature
414