Page 32 - Petelin Ana. Ur. 2022. Zdravje otrok in mladostnikov / Health of children and adolescents. Proceedings. Koper: Založba Univerze na Primorskem/University of Primorska Press
P. 32
laration of Helsinki and the experiment was approved by the National Medical
Ethics Committee for Research on Children and Adolescents, obtained 23th of
January 2018, (approval no: 0120-631/2017/2).
zdravje otrok in mladostnikov | health of children and adolescents 32 Study design
Participants were instructed by the researchers to wear an accelerometer
(GT3X+, ActiGraph, USA) concurrently around their waist for 10 consecu-
tive days between 3.10.2020 and 12.10.2020 (from Saturday to Monday). We in-
structed parents and gymnasts to put the device on immediately after waking
up and asked them to remove the device only for aquatic activities, showering/
bathing and sleeping. After the devices were returned, the data were download-
ed in 30-s epoch lengths using ActiLife (Version 6.13.4; 2009-2015 ActiGraph
LLC) and saved in raw format as GT3X files. Inclusion criteria for data valida-
tion were based on equal wearing time of participants putting the device on
soon after waking up and to take off before going to bed. A compliant record-
ing requires at least 10 hours of awake wear time per day, including at least 5
valid weekdays and at least 2 valid weekend days.
Statistical analysis
Statistical analysis was conducted with IBM SPSS Statistic 26 (IBM, New
York, USA). We calculated descriptive statistics (mean value ± standard
deviation, minimum and maximum value) for all descriptive parameters of
the participants. The normality of the data distribution was checked with Sha-
piro-Wilk test. Differences between groups were assessed with the dependent-
samples t-test. Hedges g effect sizes (ES) were calculated and interpreted as sug-
gested suggestions by Rhea where: < 0.25 = trivial; 0.25-0.50 = small; 0.51-1.0 =
moderate and > 1.0 = large (Rhea, 2004). The threshold for statistical signifi-
cance was set at p < 0.05.
Results
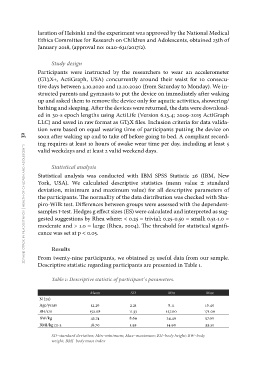
From twenty-nine participants, we obtained 25 useful data from our sample.
Descriptive statistic regarding participants are presented in Table 1.
Table 1: Descriptive statistic of participant`s parameters.
Mean SD Min Max
N (25) 12.26 2.21 8.11 16.40
Age/years
BH/cm 152.08 11.33 127.00 171.00
BW/kg 43.74 8.69 24.40 57.00
BMI/kg m-2 18.70 1.59 14.90 22.30
SD–standard deviation; Min–minimum; Max–maximum; BH–body height; BW–body
weight; BMI–body mass index
Ethics Committee for Research on Children and Adolescents, obtained 23th of
January 2018, (approval no: 0120-631/2017/2).
zdravje otrok in mladostnikov | health of children and adolescents 32 Study design
Participants were instructed by the researchers to wear an accelerometer
(GT3X+, ActiGraph, USA) concurrently around their waist for 10 consecu-
tive days between 3.10.2020 and 12.10.2020 (from Saturday to Monday). We in-
structed parents and gymnasts to put the device on immediately after waking
up and asked them to remove the device only for aquatic activities, showering/
bathing and sleeping. After the devices were returned, the data were download-
ed in 30-s epoch lengths using ActiLife (Version 6.13.4; 2009-2015 ActiGraph
LLC) and saved in raw format as GT3X files. Inclusion criteria for data valida-
tion were based on equal wearing time of participants putting the device on
soon after waking up and to take off before going to bed. A compliant record-
ing requires at least 10 hours of awake wear time per day, including at least 5
valid weekdays and at least 2 valid weekend days.
Statistical analysis
Statistical analysis was conducted with IBM SPSS Statistic 26 (IBM, New
York, USA). We calculated descriptive statistics (mean value ± standard
deviation, minimum and maximum value) for all descriptive parameters of
the participants. The normality of the data distribution was checked with Sha-
piro-Wilk test. Differences between groups were assessed with the dependent-
samples t-test. Hedges g effect sizes (ES) were calculated and interpreted as sug-
gested suggestions by Rhea where: < 0.25 = trivial; 0.25-0.50 = small; 0.51-1.0 =
moderate and > 1.0 = large (Rhea, 2004). The threshold for statistical signifi-
cance was set at p < 0.05.
Results
From twenty-nine participants, we obtained 25 useful data from our sample.
Descriptive statistic regarding participants are presented in Table 1.
Table 1: Descriptive statistic of participant`s parameters.
Mean SD Min Max
N (25) 12.26 2.21 8.11 16.40
Age/years
BH/cm 152.08 11.33 127.00 171.00
BW/kg 43.74 8.69 24.40 57.00
BMI/kg m-2 18.70 1.59 14.90 22.30
SD–standard deviation; Min–minimum; Max–maximum; BH–body height; BW–body
weight; BMI–body mass index