
Page 169 - Vseživljenjsko učenje kot temelj trajnostne družbe
P. 169
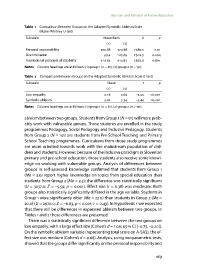
Ableism and Mindset of Future Educators
Table 1 Comparison Between Groups on the Adapted Symbolic Ableism Scale
(Mann-Whitney U-test)
Subscale Mean Rank U p
() ()
Personal responsibility . . . .
Discrimination . . . .
Inspirational portrayal of disability . . . .
Notes Column headings are as follows: (1) group 1 (n =81), (2) group2(n =151).
Table 2 Comparison Between Groups on the Adapted Symbolic Ableism Scale (t-test)
Subscale Mean t p
() ()
Low empathy . . –. <.
Symbolic ableism . . –. <.
Notes Column headings are as follows: (1) group 1 (n =81), (2) group2(n =151).
ableism between two groups. Students from Group 1 (N =81) will more prob-
ably work with vulnerable groups. Those students are enrolled in the study
programmes Pedagogy, Social Pedagogy and Inclusive Pedagogy. Students
from Group 2 (N = 151) are students from Pre-School Teaching and Primary
School Teaching programmes. Curriculums from those study programmes
are more oriented towards work with the mainstream population of chil-
dren and students. However, because of the inclusive paradigm in Slovenian
primary and pre-school education, those students also receive some knowl-
edge on working with vulnerable groups. Analysis of differences between
groups in self-assessed knowledge confirmed that students from Group 1
(Me = 3.0) report higher knowledge on topics from special education than
students from Group 2 (Me = 2.5); the difference was statistically significant
(U = 3037.0; Z = –5.59; p < 0.001). Effect size (r =0.38) wasmoderate. Both
groups also statistically significantly differed in the age variable. Students in
Group 1 were significantly older (Me = 22.0) than students in Group 2 (Me =
20.0) (U = 2970.0; Z = –6.63, p < 0.001; r = 0.43). In Hypothesis 1 we expected
that there will be differences in expressed ableism between two groups. In
Tables 1 and 2 those differences are presented.
There was a statistically significant difference between the two groups on
low empathy, with a large effect size (Cohen’s d = 1.06; 95 CI [–0.75, –0.20]).
On the symbolic ableism variable (representing total score on A-SAS), the ef-
fect size was medium (Cohen’s d = 0.68). Analysis, using nonparametric tests,
showed that the groups differ significantly on the personal responsibility and
169