Page 155 - Petelin Ana. Ur. 2022. Zdravje otrok in mladostnikov / Health of children and adolescents. Proceedings. Koper: Založba Univerze na Primorskem/University of Primorska Press
P. 155
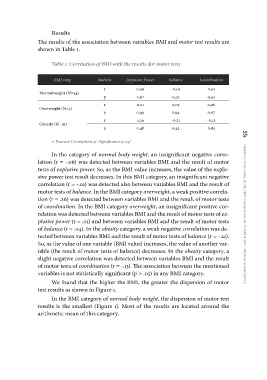
Results
The results of the association between variables BMI and motor test results are
shown in Table 1.
Table 1: Correlation of BMI with the results dor motor tests
BMI rang Statistic Explosive Power Balance Coordination
Normalweight (N=54)
Overweight (N=5) r 0,06 -0,01 0,01
Obesity (N=16) p 0,67 0,92 0,92
r 0,01 0,05 0,26
p 0,99 0,94 0,67
r 0,19 -0,21 -0,13
p 0,48 0,43 0,63
r- Pearson Correlation; p- Significance (0.05) relationship of body mass index with some motor abilities of preschool children 155
In the category of normal body weight, an insignificant negative corre-
lation (r = -.06) was detected between variables BMI and the result of motor
tests of explosive power. So, as the BMI value increases, the value of the explo-
sive power test result decreases. In this BMI category, an insignificant negative
correlation (r = -.01) was detected also between variables BMI and the result of
motor tests of balance. In the BMI category overweight, a weak positive correla-
tion (r = .26) was detected between variables BMI and the result of motor tests
of coordination. In the BMI category overweight, an insignificant positive cor-
relation was detected between variables BMI and the result of motor tests of ex-
plosive power (r = .01) and between variables BMI and the result of motor tests
of balance (r = .04). In the obesity category, a weak negative correlation was de-
tected between variables BMI and the result of motor tests of balance (r = -.21).
So, as the value of one variable (BMI value) increases, the value of another var-
iable (the result of motor tests of balance) decreases. In the obesity category, a
slight negative correlation was detected between variables BMI and the result
of motor tests of coordination (r = -.13). The association between the mentioned
variables is not statistically significant (p > .05) in any BMI category.
We found that the higher the BMI, the greater the dispersion of motor
test results as shown in Figure 1.
In the BMI category of normal body weight, the dispersion of motor test
results is the smallest (Figure 1). Most of the results are located around the
arithmetic mean of this category.