Page 7 - Fister jr., Iztok, Andrej Brodnik, Matjaž Krnc and Iztok Fister (eds.). StuCoSReC. Proceedings of the 2019 6th Student Computer Science Research Conference. Koper: University of Primorska Press, 2019
P. 7
orithm 1 Algorithm of online LSTM training. the rest 30% to out-of-sample. Framework is implemented
in the Python programming language, using the Keras Deep
1: procedure Online LSTM training Learning Library2. A two layered stacked LSTM and Adam
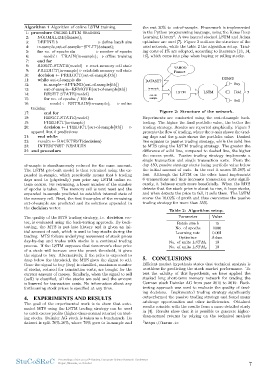
optimizer are used [7]. Figure 2 outlines the structure of the
2: NORMALIZE(dataset); used network, while the table 2 the algorithm setup. Trad-
ing costs of 1% are adopted, according to literature [13, 14,
3: DEFINE b define batch size 16], which come into play when buying or selling stocks.
4: in-sample,out-of-sample=SPLIT(dataset);
5: for no. of epochs do number of epochs
6: model ← TRAIN(in-sample); offline training
7: end for
8: RESET STATE(model) reset memory cell state DATASET YAHOO DENSE
9: PREDICT(in-sample) establish memory cell state Finance Buy
10: decision ← PREDICT(out-of-sample[0:b]) in-sample
11: while out-of-sample do LSTM Hold
out-of-
12: in-sample=APPEND(out-of-sample[0:b]) sample Sell
13: out-of-sample=REMOVE(out-of-sample[0:b]) LSTM y
14: RESET STATE(model)
15: for no. of epochs / 100 do
16: model ← RETRAIN(in-sample); online
training Figure 2: Structure of the network.
17: end for Experiments are conducted using the out-of-sample back-
testing. The higher the final portfolio value, the better the
18: RESET STATE(model) trading strategy. Results are reported graphically. Figure 3
19: PREDICT(in-sample) presents the flow of trading, where the x-axis shows the trad-
20: decision ← PREDICT(out-of-sample[0:b]) ing days and the y-axis shows the portfolio value. Dashed
line equates to passive trading strategy, while the solid line
append first b predictions to MTS using the LSTM trading strategy. The greater the
difference of solid line, compared to dashed line, the higher
21: end while the excess profit. Passive trading strategy implements a
22: results ← BACKTEST(decision) single transaction and single transaction costs. From the
23: INTERPRET RESULTS day 450, passive strategy starts losing portfolio value below
24: end procedure the initial amount of cash. In the end it scores 25.28% of
loss. Although the LSTM on the other hand implements
of-sample is simultaneously reduced for the same amount. 6 transactions and thus increases transaction costs signifi-
The LSTM pre-built model is then retrained using the ex- cantly, it behaves much more beneficially. When the MTS
panded in-sample, which practically means that b trading detects that the stock price is about to rise, it buys stocks,
days need to (physically) pass prior any LSTM online re- and when detects the price to fall, it sells them. The LSTM
train occurs. For retraining, a lower number of the number scores the 16.02% of profit and thus overcomes the passive
of epochs is taken. The memory cell is next reset and the trading strategy for more than 55%.
expanded in-sample predicted to establish internal state of
the memory cell. Next, the first b-samples of the remaining Table 2: Algorithm setup.
out-of-sample are predicted and its solutions appended in
the decision vector. Parameter Value
The quality of the MTS trading strategy, i.e. decision vec- Batch size b 15
tor, is evaluated using the back-testing approach. By back- No. of epochs 1000
testing, the MTS is put into history and is given an ini- Learning rate 0.001
tial amount of cash, which is used to buy stocks during the Adam
trading. MTS follows underlying movement of stock prices Optimizer
day-by-day and trades with stocks in a continual trading No. of units LST M1 10
process. If the LSTM supposes that tomorrow’s close price No. of units LST M2 10
of a stock will increase over the preset threshold, it gives
the signal to buy. Alternatively, if the price is expected to 5. CONCLUSIONS
drop below the threshold, the MTS gives the signal to sell.
Once the signal to buy (buy) is classified, maximum number Efficient market hypothesis states that technical analysis is
of stocks, reduced for transaction costs, are bought for the worthless for predicting the stock market performance. To
current amount of money. Similarly, when the signal to sell test the validity of this hypothesis, we have applied the
(sell) is classified, all the stocks are sold and the amount stacked long short-term memory network for trading the
is lowered for transaction costs. No information about any German stock Daimler AG from year 2010 to 2019. Back-
forthcoming stock prices is specified at any time. testing approach was used to evaluate the quality of trad-
ing decisions. Implemented trading strategy significantly
4. EXPERIMENTS AND RESULTS outperformed the passive trading strategy and found many
arbitrage opportunities and other inefficiencies. Obtained
The goal of the experimental work is to show that auto- results coincide with the results from a more detailed study
mated MTS using the LSTM trading strategy can be used in [4]. Results show that it is possible to generate higher-
to catch excess profits (higher-than-normal returns) on trad- than-normal returns by relying on the technical analysis
ing stocks. Daimler AG stock is taken as a benchmark. Its
dataset is split 70%-30%, where 70% goes to in-sample and 2https://keras.io
StuCoSReC Proceedings of the 2019 6th Student Computer Science Research Conference 7
Koper, Slovenia, 10 October
in the Python programming language, using the Keras Deep
1: procedure Online LSTM training Learning Library2. A two layered stacked LSTM and Adam
optimizer are used [7]. Figure 2 outlines the structure of the
2: NORMALIZE(dataset); used network, while the table 2 the algorithm setup. Trad-
ing costs of 1% are adopted, according to literature [13, 14,
3: DEFINE b define batch size 16], which come into play when buying or selling stocks.
4: in-sample,out-of-sample=SPLIT(dataset);
5: for no. of epochs do number of epochs
6: model ← TRAIN(in-sample); offline training
7: end for
8: RESET STATE(model) reset memory cell state DATASET YAHOO DENSE
9: PREDICT(in-sample) establish memory cell state Finance Buy
10: decision ← PREDICT(out-of-sample[0:b]) in-sample
11: while out-of-sample do LSTM Hold
out-of-
12: in-sample=APPEND(out-of-sample[0:b]) sample Sell
13: out-of-sample=REMOVE(out-of-sample[0:b]) LSTM y
14: RESET STATE(model)
15: for no. of epochs / 100 do
16: model ← RETRAIN(in-sample); online
training Figure 2: Structure of the network.
17: end for Experiments are conducted using the out-of-sample back-
testing. The higher the final portfolio value, the better the
18: RESET STATE(model) trading strategy. Results are reported graphically. Figure 3
19: PREDICT(in-sample) presents the flow of trading, where the x-axis shows the trad-
20: decision ← PREDICT(out-of-sample[0:b]) ing days and the y-axis shows the portfolio value. Dashed
line equates to passive trading strategy, while the solid line
append first b predictions to MTS using the LSTM trading strategy. The greater the
difference of solid line, compared to dashed line, the higher
21: end while the excess profit. Passive trading strategy implements a
22: results ← BACKTEST(decision) single transaction and single transaction costs. From the
23: INTERPRET RESULTS day 450, passive strategy starts losing portfolio value below
24: end procedure the initial amount of cash. In the end it scores 25.28% of
loss. Although the LSTM on the other hand implements
of-sample is simultaneously reduced for the same amount. 6 transactions and thus increases transaction costs signifi-
The LSTM pre-built model is then retrained using the ex- cantly, it behaves much more beneficially. When the MTS
panded in-sample, which practically means that b trading detects that the stock price is about to rise, it buys stocks,
days need to (physically) pass prior any LSTM online re- and when detects the price to fall, it sells them. The LSTM
train occurs. For retraining, a lower number of the number scores the 16.02% of profit and thus overcomes the passive
of epochs is taken. The memory cell is next reset and the trading strategy for more than 55%.
expanded in-sample predicted to establish internal state of
the memory cell. Next, the first b-samples of the remaining Table 2: Algorithm setup.
out-of-sample are predicted and its solutions appended in
the decision vector. Parameter Value
The quality of the MTS trading strategy, i.e. decision vec- Batch size b 15
tor, is evaluated using the back-testing approach. By back- No. of epochs 1000
testing, the MTS is put into history and is given an ini- Learning rate 0.001
tial amount of cash, which is used to buy stocks during the Adam
trading. MTS follows underlying movement of stock prices Optimizer
day-by-day and trades with stocks in a continual trading No. of units LST M1 10
process. If the LSTM supposes that tomorrow’s close price No. of units LST M2 10
of a stock will increase over the preset threshold, it gives
the signal to buy. Alternatively, if the price is expected to 5. CONCLUSIONS
drop below the threshold, the MTS gives the signal to sell.
Once the signal to buy (buy) is classified, maximum number Efficient market hypothesis states that technical analysis is
of stocks, reduced for transaction costs, are bought for the worthless for predicting the stock market performance. To
current amount of money. Similarly, when the signal to sell test the validity of this hypothesis, we have applied the
(sell) is classified, all the stocks are sold and the amount stacked long short-term memory network for trading the
is lowered for transaction costs. No information about any German stock Daimler AG from year 2010 to 2019. Back-
forthcoming stock prices is specified at any time. testing approach was used to evaluate the quality of trad-
ing decisions. Implemented trading strategy significantly
4. EXPERIMENTS AND RESULTS outperformed the passive trading strategy and found many
arbitrage opportunities and other inefficiencies. Obtained
The goal of the experimental work is to show that auto- results coincide with the results from a more detailed study
mated MTS using the LSTM trading strategy can be used in [4]. Results show that it is possible to generate higher-
to catch excess profits (higher-than-normal returns) on trad- than-normal returns by relying on the technical analysis
ing stocks. Daimler AG stock is taken as a benchmark. Its
dataset is split 70%-30%, where 70% goes to in-sample and 2https://keras.io
StuCoSReC Proceedings of the 2019 6th Student Computer Science Research Conference 7
Koper, Slovenia, 10 October