Page 6 - Fister jr., Iztok, Andrej Brodnik, Matjaž Krnc and Iztok Fister (eds.). StuCoSReC. Proceedings of the 2019 6th Student Computer Science Research Conference. Koper: University of Primorska Press, 2019
P. 6
ch is also a combination of sigmoid and tanh function, writing. It is one of the blue-chip stocks, listed in the index
is used to output relevant information from the memory of 30 most prominent German companies DAX30. The stock
cell and transfer the information into following time step. data is obtained from Yahoo Finance website1, during the
LSTM layer can be single, or stacked into multi-layered net- period from 4 Jan 2010 - 7 Jun 2019 on a daily basis. Fol-
works. Figure 1 shows the individual LSTM layer, which lowing data is downloaded: the highest daily price (High),
is sufficient for many cases. For more comprehensive (e.g. the lowest daily price (Low), open price (Open), close price
non-stationary) data, [1] suggests the use of stacked LSTM (Close), daily volume (V olume) and adjusted close price
network, e.g. two individual LSTM layers composed into a (AdjClose). The data is downloaded for the Daimler AG
single network. stock and DAX30 industrial index. Composing those two
into a dataset, several other variables are derived from. In
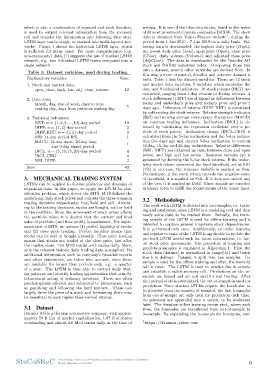
Table 1: Dataset variables, used during trading. this way, a more expanded, detailed and concrete dataset is
built. Table 1 lists the dataset variables. There are 12 stock
Explanatory variables Vars. and market data variables, 5 variables which symbolize the
date and 8 technical indicators. 10 stock returns (RET) are
1. Stock and market data: 12 extracted, ranging from 1-day returns to 10-day returns. 2
open, close, high, low, adj. close, volume stock differences (DIFF) are obtained as differences between
today and yesterday’s price and today’s price and price 2
2. Date data: 5 days ago. Difference of returns (DIFF RET) is calculated
month, day, day of week, days to next by subtracting the stock returns. Relative strength indicator
trading day, days from previous trading day (RSI) and moving average convergence divergence (MACD)
are common trading indicators. Inclination (INCL) is ob-
3. Technical indicators: 10 tained by calculating the regression coefficient over n pe-
RET: n = {1, 2, 3, ..., 10}-day period 2 riods of stock prices. Inclination change (INCL CHG) is
DIFF: n = {1, 2}-day period 2 calculated from the 5-day inclination and the 5-day inclina-
DIFF RET: n = {1, 2}-day period 1 tion five days ago and current 5-day inclination to current
RSI: 14-day period RSI 10-day, 15-day and 20-day inclinations. Relative differences
MACD: 12-day short, 26-day long 1 (REL DIFF) are obtained as ratio between close and open
and 9-day signal period prices, and high and low prices. Response variable (y) is
INCL: n = {5, 10, 15, 20}-day period 4 generated by deriving the 1-day stock returns. If the under-
INCL CHG: 4 lying stock return overcomes the fixed threshold, set at 0.01
REL DIFF: 2 (1%) in our case, the response variable is marked as Buy.
Furthermore, if the stock return exceeds the negative value
Sum 43 of threshold, it is marked as Sell. If it does not exceed any
of the two, it is marked as Hold. These signals are encoded
3. MECHANICAL TRADING SYSTEM in binary form to fulfill the requirements of the dense layer.
LSTMs can be applied to diverse problems and domains of 3.2 Methodology
sequential data. In this paper, we apply the LSTM for clas-
sification problem, which drives the MTS. MTS follows the The work with LSTM is divided into two samples, i.e. train-
underlying daily stock prices and outputs the three common ing and prediction, since LSTM is a modeling tool and thus
trading decisions respectively: buy, hold and sell. Accord- needs some data to be trained from. Initially, the train-
ing to the trading decisions, stocks are bought, sold or held ing sample of the LSTM is used for offline training and is
in the portfolio. Since the movement of stock prices affects intended to capture general long-term stock dependencies.
the portfolio value, it is desired that the current and final It is performed only once. Additionally, an online learning
value of portfolio (and thus profit), is maximized. For imple- and regular re-train of the LSTM is applicable to update the
mentation of MTS, we assume (1) perfect liquidity of stocks pre-built LSTM model with the latest information, i.e. lat-
and (2) close price trading. Perfect liquidity means that est stock price movements. The procedure of training and
stocks can be sold or bought instantly. Close price trading prediction samples is explained in Algorithm 1. First the
means that stocks are traded at the close price, just after stock data (dataset) is normalized in range(0,1) and batch
the market close. The MTS trades with stocks daily. Here, size b is defined. Dataset is split into two samples. In-
only the relevant historic daily trading data is supplied. No sample is used for the offline training and after, the memory
additional information, such as company’s financial reports cell is reset. The LSTM is used to predict the in-sample
and other statements, are taken into account, since these and establish a stable memory cell. Predictions on the in-
are available for longer time periods only, e.g. a quarter sample are biased and are not used for real trading. After
of a year. The LSTM is thus able to extract daily trad- the internal state is established, the out-of-sample is used for
ing patterns and identify trading opportunities that arise by prediction. Since stacked LSTMs require the batch size to
behavioural acting of ordinary investors. These are often be divisible from the number of samples, the first b-samples
psychologically-affected and subjected to phenomena, such from out-of-sample are only used for prediction each time.
as panicking and following the herd instinct. Those two Its solutions are appended into a vector, to be evaluated
largely drive the price of a stock and forecasting them may later. The iterative online training comes next, where each
be beneficial to earn higher-than-normal returns. time, the b-samples are transferred from out-of-sample to
in-sample. By expanding the in-sample for b-samples, out-
3.1 Dataset
1https://finance.yahoo.com
Daimler AG is a German automotive company, with approx-
imately 50 B Eur of market capitalization, 1.07 B of shares
outstanding and almost 4.6 M of trades daily, at the time of
StuCoSReC Proceedings of the 2019 6th Student Computer Science Research Conference 6
Koper, Slovenia, 10 October
is used to output relevant information from the memory of 30 most prominent German companies DAX30. The stock
cell and transfer the information into following time step. data is obtained from Yahoo Finance website1, during the
LSTM layer can be single, or stacked into multi-layered net- period from 4 Jan 2010 - 7 Jun 2019 on a daily basis. Fol-
works. Figure 1 shows the individual LSTM layer, which lowing data is downloaded: the highest daily price (High),
is sufficient for many cases. For more comprehensive (e.g. the lowest daily price (Low), open price (Open), close price
non-stationary) data, [1] suggests the use of stacked LSTM (Close), daily volume (V olume) and adjusted close price
network, e.g. two individual LSTM layers composed into a (AdjClose). The data is downloaded for the Daimler AG
single network. stock and DAX30 industrial index. Composing those two
into a dataset, several other variables are derived from. In
Table 1: Dataset variables, used during trading. this way, a more expanded, detailed and concrete dataset is
built. Table 1 lists the dataset variables. There are 12 stock
Explanatory variables Vars. and market data variables, 5 variables which symbolize the
date and 8 technical indicators. 10 stock returns (RET) are
1. Stock and market data: 12 extracted, ranging from 1-day returns to 10-day returns. 2
open, close, high, low, adj. close, volume stock differences (DIFF) are obtained as differences between
today and yesterday’s price and today’s price and price 2
2. Date data: 5 days ago. Difference of returns (DIFF RET) is calculated
month, day, day of week, days to next by subtracting the stock returns. Relative strength indicator
trading day, days from previous trading day (RSI) and moving average convergence divergence (MACD)
are common trading indicators. Inclination (INCL) is ob-
3. Technical indicators: 10 tained by calculating the regression coefficient over n pe-
RET: n = {1, 2, 3, ..., 10}-day period 2 riods of stock prices. Inclination change (INCL CHG) is
DIFF: n = {1, 2}-day period 2 calculated from the 5-day inclination and the 5-day inclina-
DIFF RET: n = {1, 2}-day period 1 tion five days ago and current 5-day inclination to current
RSI: 14-day period RSI 10-day, 15-day and 20-day inclinations. Relative differences
MACD: 12-day short, 26-day long 1 (REL DIFF) are obtained as ratio between close and open
and 9-day signal period prices, and high and low prices. Response variable (y) is
INCL: n = {5, 10, 15, 20}-day period 4 generated by deriving the 1-day stock returns. If the under-
INCL CHG: 4 lying stock return overcomes the fixed threshold, set at 0.01
REL DIFF: 2 (1%) in our case, the response variable is marked as Buy.
Furthermore, if the stock return exceeds the negative value
Sum 43 of threshold, it is marked as Sell. If it does not exceed any
of the two, it is marked as Hold. These signals are encoded
3. MECHANICAL TRADING SYSTEM in binary form to fulfill the requirements of the dense layer.
LSTMs can be applied to diverse problems and domains of 3.2 Methodology
sequential data. In this paper, we apply the LSTM for clas-
sification problem, which drives the MTS. MTS follows the The work with LSTM is divided into two samples, i.e. train-
underlying daily stock prices and outputs the three common ing and prediction, since LSTM is a modeling tool and thus
trading decisions respectively: buy, hold and sell. Accord- needs some data to be trained from. Initially, the train-
ing to the trading decisions, stocks are bought, sold or held ing sample of the LSTM is used for offline training and is
in the portfolio. Since the movement of stock prices affects intended to capture general long-term stock dependencies.
the portfolio value, it is desired that the current and final It is performed only once. Additionally, an online learning
value of portfolio (and thus profit), is maximized. For imple- and regular re-train of the LSTM is applicable to update the
mentation of MTS, we assume (1) perfect liquidity of stocks pre-built LSTM model with the latest information, i.e. lat-
and (2) close price trading. Perfect liquidity means that est stock price movements. The procedure of training and
stocks can be sold or bought instantly. Close price trading prediction samples is explained in Algorithm 1. First the
means that stocks are traded at the close price, just after stock data (dataset) is normalized in range(0,1) and batch
the market close. The MTS trades with stocks daily. Here, size b is defined. Dataset is split into two samples. In-
only the relevant historic daily trading data is supplied. No sample is used for the offline training and after, the memory
additional information, such as company’s financial reports cell is reset. The LSTM is used to predict the in-sample
and other statements, are taken into account, since these and establish a stable memory cell. Predictions on the in-
are available for longer time periods only, e.g. a quarter sample are biased and are not used for real trading. After
of a year. The LSTM is thus able to extract daily trad- the internal state is established, the out-of-sample is used for
ing patterns and identify trading opportunities that arise by prediction. Since stacked LSTMs require the batch size to
behavioural acting of ordinary investors. These are often be divisible from the number of samples, the first b-samples
psychologically-affected and subjected to phenomena, such from out-of-sample are only used for prediction each time.
as panicking and following the herd instinct. Those two Its solutions are appended into a vector, to be evaluated
largely drive the price of a stock and forecasting them may later. The iterative online training comes next, where each
be beneficial to earn higher-than-normal returns. time, the b-samples are transferred from out-of-sample to
in-sample. By expanding the in-sample for b-samples, out-
3.1 Dataset
1https://finance.yahoo.com
Daimler AG is a German automotive company, with approx-
imately 50 B Eur of market capitalization, 1.07 B of shares
outstanding and almost 4.6 M of trades daily, at the time of
StuCoSReC Proceedings of the 2019 6th Student Computer Science Research Conference 6
Koper, Slovenia, 10 October