Page 16 - Fister jr., Iztok, Andrej Brodnik, Matjaž Krnc and Iztok Fister (eds.). StuCoSReC. Proceedings of the 2019 6th Student Computer Science Research Conference. Koper: University of Primorska Press, 2019
P. 16
ration will allow it to try and recover the functionality unexpected failures with firmware updates. The data from
of the probe or at least receive the most critical data. the additional sensors will be used for the analysis of the
surroundings of the probe (e.g., water pollution). For data
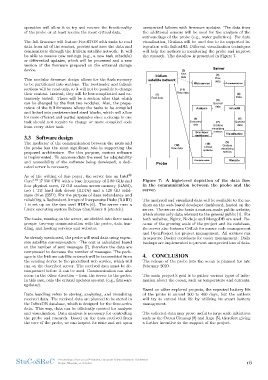
The full firmware will feature FreeRTOS with tasks to read visualization, Grafana will be used due to its supported in-
data from all of the sensors, process and save the data and tegration with InfluxDB. Different visualization techniques
communicate through the Iridium satellite network. It will will help the authors in monitoring the probe and improve
be able to receive new settings (e.g., a new task schedule) the research. The dataflow is presented in Figure 7.
or differential updates, which will be processed and a new
version of the firmware prepared on the external storage (2) Server
device. Raw
Iridium (3)
This modular firmware design allows for the flash memory satellite network data Raw
to be partitioned into sections. The bootloader and failsafe
sections will be read-only, so it will not be possible to change Web service data Decompression
their content. Instead, they will be less complicated and ex-
tensively tested. There will be a section after that which (1) (11) (4)
can be changed by the first two modules. Also, the prepa- Raw data Raw data Data
ration of the full firmware allows the tasks to be compiled
and linked into predetermined sized blocks, which will allow Analysis (5) InfluxDB
for more efficient and partial upgrades since a change in one Queried
task should not require to change or move compiled code
from every other task. data
3.3 Software design (8) (6)
Evaluated
The mediator of the communication between the users and (7) Queried
the probe has the most significant role in supporting the data data
proposed architecture. For this purpose, custom software Grafana
is implemented. To accommodate the need for adaptability Developer
and accessibility of the software being developed, a dedi- dashboard visualizing
cated server is necessary.
metrics
As of the writing of this paper, the server has an Intel R Visualization
CoreTM i7 930 CPU with a base frequency of 2.80 GHz and
four physical cores, 12 GB random access memory (RAM), (12) (10) (9)
two 1 TB hard disk drives (HDDs) and a 128 GB solid- Raw data Critical Grafana
state drive (SSD). For the purpose of data redundancy and visualizing
reliability, a Redundant Arrays of Inexpensive Disks (RAID) Probe updates metrics
1 is set up on the two used HDDs [6]. The server runs a
Linux operating system Debian Gnu/Linux 9 (stretch). Compression Website
The tasks, running on the server, are divided into three main Figure 7: A high-level depiction of the data flow
groups: two-way communication with the probe, data han- in the communication between the probe and the
dling, and hosting services and websites. server.
As already mentioned, the probe will send data using expen- The analyzed and visualized data will be available to the au-
sive satellite communication. The cost is calculated based thors on the web-based developer dashboard, hosted on the
on the number of sent messages [7], therefore the data are server. The server also hosts a custom-made public website,
compressed to decrease the number of messages. The pack- which shows only data relevant to the general public [1]. For
ages in the Iridium satellite network will be transmitted from both websites, Nginx, Node.js and MongoDB are used. Be-
the sending device to the predefined web service, which will cause of the growing scale of the project and its codebase,
run on the described server. The received data must be de- the server also features GitLab for source code management
compressed before it can be used. Communication can also and OpenProject for project management. All services run
occur in the other direction – from the server to the probe. in separate Docker containers for easier management. Daily
In this case, only the critical updates are sent (e.g., firmware backups are implemented to prevent unexpected loss of data.
updates).
4. CONCLUSION
Data handling refers to storing, analyzing, and visualizing
received data. The received data are planned to be stored in The release of the probe into the ocean is planned for late
the InfluxDB database, which is designed for the time-series February 2020.
data. This way, data can be efficiently queried for analysis
and visualization. Data analysis is necessary for controlling The main project’s goal is to gather various types of infor-
the probe and research. Based on the data received from mation about the ocean, such as temperature and currents.
the core of the probe, we can inspect its state and act upon
Based on other explored projects, the expected battery life
of the probe is around 300 to 400 days, but the authors
will try to extend that life by utilizing its smart battery
management.
The collected data may prove useful to large scale initiatives
such as the Ocean Cleanup [8] and Argo [5], therefore giving
a further incentive to the support of the project.
StuCoSReC Proceedings of the 2019 6th Student Computer Science Research Conference 16
Koper, Slovenia, 10 October
of the probe or at least receive the most critical data. the additional sensors will be used for the analysis of the
surroundings of the probe (e.g., water pollution). For data
The full firmware will feature FreeRTOS with tasks to read visualization, Grafana will be used due to its supported in-
data from all of the sensors, process and save the data and tegration with InfluxDB. Different visualization techniques
communicate through the Iridium satellite network. It will will help the authors in monitoring the probe and improve
be able to receive new settings (e.g., a new task schedule) the research. The dataflow is presented in Figure 7.
or differential updates, which will be processed and a new
version of the firmware prepared on the external storage (2) Server
device. Raw
Iridium (3)
This modular firmware design allows for the flash memory satellite network data Raw
to be partitioned into sections. The bootloader and failsafe
sections will be read-only, so it will not be possible to change Web service data Decompression
their content. Instead, they will be less complicated and ex-
tensively tested. There will be a section after that which (1) (11) (4)
can be changed by the first two modules. Also, the prepa- Raw data Raw data Data
ration of the full firmware allows the tasks to be compiled
and linked into predetermined sized blocks, which will allow Analysis (5) InfluxDB
for more efficient and partial upgrades since a change in one Queried
task should not require to change or move compiled code
from every other task. data
3.3 Software design (8) (6)
Evaluated
The mediator of the communication between the users and (7) Queried
the probe has the most significant role in supporting the data data
proposed architecture. For this purpose, custom software Grafana
is implemented. To accommodate the need for adaptability Developer
and accessibility of the software being developed, a dedi- dashboard visualizing
cated server is necessary.
metrics
As of the writing of this paper, the server has an Intel R Visualization
CoreTM i7 930 CPU with a base frequency of 2.80 GHz and
four physical cores, 12 GB random access memory (RAM), (12) (10) (9)
two 1 TB hard disk drives (HDDs) and a 128 GB solid- Raw data Critical Grafana
state drive (SSD). For the purpose of data redundancy and visualizing
reliability, a Redundant Arrays of Inexpensive Disks (RAID) Probe updates metrics
1 is set up on the two used HDDs [6]. The server runs a
Linux operating system Debian Gnu/Linux 9 (stretch). Compression Website
The tasks, running on the server, are divided into three main Figure 7: A high-level depiction of the data flow
groups: two-way communication with the probe, data han- in the communication between the probe and the
dling, and hosting services and websites. server.
As already mentioned, the probe will send data using expen- The analyzed and visualized data will be available to the au-
sive satellite communication. The cost is calculated based thors on the web-based developer dashboard, hosted on the
on the number of sent messages [7], therefore the data are server. The server also hosts a custom-made public website,
compressed to decrease the number of messages. The pack- which shows only data relevant to the general public [1]. For
ages in the Iridium satellite network will be transmitted from both websites, Nginx, Node.js and MongoDB are used. Be-
the sending device to the predefined web service, which will cause of the growing scale of the project and its codebase,
run on the described server. The received data must be de- the server also features GitLab for source code management
compressed before it can be used. Communication can also and OpenProject for project management. All services run
occur in the other direction – from the server to the probe. in separate Docker containers for easier management. Daily
In this case, only the critical updates are sent (e.g., firmware backups are implemented to prevent unexpected loss of data.
updates).
4. CONCLUSION
Data handling refers to storing, analyzing, and visualizing
received data. The received data are planned to be stored in The release of the probe into the ocean is planned for late
the InfluxDB database, which is designed for the time-series February 2020.
data. This way, data can be efficiently queried for analysis
and visualization. Data analysis is necessary for controlling The main project’s goal is to gather various types of infor-
the probe and research. Based on the data received from mation about the ocean, such as temperature and currents.
the core of the probe, we can inspect its state and act upon
Based on other explored projects, the expected battery life
of the probe is around 300 to 400 days, but the authors
will try to extend that life by utilizing its smart battery
management.
The collected data may prove useful to large scale initiatives
such as the Ocean Cleanup [8] and Argo [5], therefore giving
a further incentive to the support of the project.
StuCoSReC Proceedings of the 2019 6th Student Computer Science Research Conference 16
Koper, Slovenia, 10 October