
Page 207 - Upland Families, Elites and Communities
P. 207
Urban Opportunities
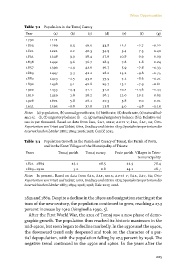
Table 7.2 Population in the Tomaj Curacy
Year (a) (b) (c) (d) (e) (f) (g)
. . . . –. –.
–. . . . –. –.
. . . . –. –.
. . . . . .
–. . . . –. –.
. . . . –. –.
–. . . . –. –.
. . . . –. –.
–. . . . –. –.
. . . . –. –.
. . . . . .
–. . . . –. –.
Notes (a) population, (b) annual growth rate, (c) birth rate, (d) death rate, (e) natural bal-
ance (c – d), (f) migratory balance (b – e), (g) natural/migratory balance (f/e). Relative val-
ues in per thousand. Based on data from šak, žat, mkk; adts v; šak, žat, sa; Orts-
Repertorium von Triest und Gebiet, Görz, Gradisca und Istrien 1873; Spezialortsrepertorium der
österreichischen Länder 1885; 1894; 1906; 1918; Cenčič 2013.
Table 7.3 Population Growth in the Parish and Curacy of Tomaj, the Parish of Povir,
and in the Karst Villages of the Municipality of Trieste
Years Tomaj parish Tomaj curacy Povir parish Villages in Tries-
te municipality
− . . . .
− . . . .
Notes In percent. Based on data from šak, žat, mkk; adts v; šak, žat, sa; Orts-
Repertorium von Triest und Gebiet, Görz, Gradisca und Istrien 1873; Spezialortsrepertorium der
österreichischen Länder 1885; 1894; 1906; 1918; Kalc 2017; 2018.
1835 and 1869. Despite a decline in the 1890s and emigration starting at the
turn of the new century, the population continued to grow, reaching a 27.3
percent increase by 1910 (Verginella 1990, 5).
After the First World War, the area of Tomaj saw a new phase of demo-
graphic growth. The population thus reached its historic maximum in the
mid-1920s, but soon began to decline markedly. In the 1930s and the 1940s,
the downward trend only deepened and took on the character of a par-
tial depopulation, with the population falling by 27.3 percent by 1948. The
negative trend continued in the 1950s and 1960s. In the years after the
205