Page 8 - Fister jr., Iztok, and Andrej Brodnik (eds.). StuCoSReC. Proceedings of the 2017 4th Student Computer Science Research Conference. Koper: University of Primorska Press, 2017
P. 8
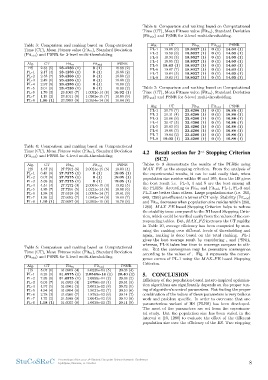
Table 6: Comparison and ranking based on Computational
Time (CT), Mean Fitness value (Fitm), Standard Deviation
(Fitstd) and PSNR for 2-level multi-thresholding.
Table 3: Comparison and ranking based on Computational Alg. CT Fitm Fitstd PSNR
Time (CT), Mean Fitness value (Fitm), Standard Deviation 18.8027 (1) 0 (1)
(Fitstd) and PSNR for 3-level multi-thresholding. PL-1 19.06 (6) 18.8027 (1) 0 (1) 14.60 (1)
PL-2 19.58 (8) 18.8027 (1) 0 (1) 14.60 (1)
Alg. CT Fitm Fitstd PSNR PL-3 18.94 (3) 18.8027 (1) 0 (1) 14.60 (1)
23.4286 (1) 0 (1) PL-4 18.85 (2) 18.8027 (1) 0 (1) 14.60 (1)
HS 2.33 (5) 23.4286 (1) 0 (1) 16.88 (2) PL-5 18.43 (1) 18.8027 (1) 0 (1) 14.60 (1)
PL-1 2.17 (4) 23.4286 (1) 0 (1) 16.88 (2) PL-6 19.07 (7) 18.8027 (1) 0 (1) 14.60 (1)
PL-2 2.58 (7) 23.4286 (1) 0 (1) 16.88 (2) PL-7 19.04 (5) 18.8027 (1) 0 (1) 14.60 (1)
PL-3 2.49 (6) 23.4286 (1) 0 (1) 16.88 (2) PL-8 19.03 (4) 14.60 (1)
PL-4 2.97 (8) 23.4286 (1) 0 (1) 16.88 (2)
PL-5 3.01 (9) 23.4065 (7) 1.0092e-14 (8) 16.88 (2) Table 7: Comparison and ranking based on Computational
PL-6 1.70 (3) 23.4011 (8) 1.0262e-15 (7) 16.92 (1) Time (CT), Mean Fitness value (Fitm), Standard Deviation
PL-7 1.15 (2) 23.3893 (9) 2.0334e-14 (9) 16.80 (9) (Fitstd) and PSNR for 3-level multi-thresholding.
PL-8 1.06 (1) 16.84 (8)
Alg. CT Fitm Fitstd PSNR
23.4286 (1) 0 (1)
PL-1 20.70 (7) 23.4286 (1) 0 (1) 16.88 (1)
PL-2 20.31 (4) 23.4286 (1) 0 (1) 16.88 (1)
PL-3 20.86 (8) 23.4286 (1) 0 (1) 16.88 (1)
PL-4 20.47 (5) 23.4286 (1) 0 (1) 16.88 (1)
PL-5 20.63 (6) 23.4286 (1) 0 (1) 16.88 (1)
PL-6 19.08 (3) 23.4286 (1) 0 (1) 16.88 (1)
PL-7 19.04 (2) 23.4286 (1) 0 (1) 16.88 (1)
PL-8 19.03 (1) 16.88 (1)
Table 4: Comparison and ranking based on Computational 4.2 Result section for 2nd Stopping Criterion
Time (CT), Mean Fitness value (Fitm), Standard Deviation (SC2)
(Fitstd) and PSNR for 4-level multi-thresholding.
Tables 6- 9 demonstrate the results of the PLHSs using
Alg. CT Fitm Fitstd PSNR M AX F E as the stopping criterion. From the analysis of
27.7252 (6) 2.0021e-15 (5) the experimental results, it can be said easily that, when
HS 4.57 (5) 27.7275 (1) 19.03 (4) population size resides within 40 and 160, then the HS gives
PL-1 6.45 (9) 27.7275 (1) 0 (1) 19.05 (1) the best result i.e. PL-3, 4 and 5 are the best among all
PL-2 6.07 (8) 27.7275 (1) 0 (1) 19.05 (1) the PLHSs. According to Fitm and Fitstd, PL-1, PL-2 and
PL-3 5.68 (6) 27.7272 (4) 0 (1) 19.05 (1) PL-3 are better than others. Large population size (i.e. 360,
PL-4 4.51 (4) 27.7256 (5) 2.0001e-15 (4) 19.02 (5) 640, 1280) are efficient in terms of CT only. Stability (Fitstd)
PL-5 4.89 (7) 27.6518 (9) 1.0121e-14 (8) 18.88 (6) and Fitm decreases when population size resides within [360,
PL-6 1.98 (3) 27.6692 (7) 1.0093e-14 (7) 18.61 (9) 1280]. M AX F E based Stopping Criterion helps to reduce
PL-7 1.35 (2) 27.6687 (8) 1.0342e-14 (9) 18.80 (7) the stability issue compared to the NI based Stopping Crite-
PL-8 1.16 (1) 2.0302e-15 (6) 18.78 (8) rion, which could be verified easily from the values of the cor-
responding tables. But, M AX F E increases the CT rapidly.
Table 5: Comparison and ranking based on Computational In Table 10, average efficiency has been computed by sum-
Time (CT), Mean Fitness value (Fitm), Standard Deviation ming the ranking over different levels of thresholding and
(Fitstd) and PSNR for 5-level multi-thresholding. again, ranking is done based on the total ranking. PL-1
gives the best average result by considering , and PSNR,
Alg. CT Fitm Fitstd PSNR whereas, PL-8 takes less time to converge compare to oth-
31.6959 (4) 3.0225e-13 (5) ers. But the convergence may be premature convergence
HS 5.07 (6) 31.6975 (1) 2.0543e-14 (1) 20.33 (4) according to the values of . Fig. 3 represents the conver-
PL-1 8.23 (9) 31.6975 (1) 2.0888e-14 (2) 20.40 (1) gence curves of PL-1 using the M AX F E based Stopping
PL-2 7.89 (8) 31.6959 (4) 2.0786e-13 (4) 20.38 (2) Criterion.
PL-3 6.03 (7) 31.6961 (3) 2.0031e-12 (8) 20.34 (3)
PL-4 4.97 (5) 31.6804 (6) 1.9021e-12 (7) 20.32 (5) 5. CONCLUSION
PL-5 4.94 (4) 31.6260 (7) 1.8763e-12 (6) 20.16 (6)
PL-6 2.78 (3) 31.5988 (9) 2.0042e-12 (9) 20.14 (7) Efficiency of the population-based nature-inspired optimiza-
PL-7 1.75 (2) 31.6055 (8) 1.0030e-13 (3) 20.10 (8) tion algorithms are significantly depends on the proper tun-
PL-8 1.18 (1) 20.11 (9) ing of algorithm’s control parameters. But finding the proper
combination of the values of these parameters is very tedious
work and problem specific. In order to overcome that one
parameterless variant of HS (PLHS) has been developed.
The most of the parameters are set from the experimen-
tal study. But the population size has been varied in the
interval ∈ [10, 1280] to evaluate the effect of the different
population size over the efficiency of the HS. Two stopping
StuCoSReC Proceedings of the 2017 4th Student Computer Science Research Conference 8
Ljubljana, Slovenia, 11 October