Page 137 - Petelin Ana. Ur. 2022. Zdravje otrok in mladostnikov / Health of children and adolescents. Proceedings. Koper: Založba Univerze na Primorskem/University of Primorska Press
P. 137
Results
The results of the research show descriptive data of variables, differences be-
tween BMI groups and the correlation of Explosive Power with fat and mus-
cle mass.
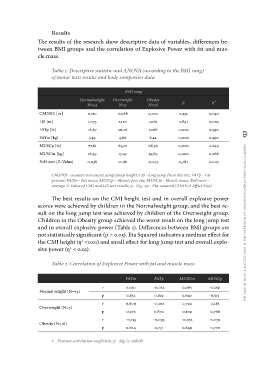
Table 1: Descriptive statistic and ANOVA (according to the BMI rang)
of motor tests results and body composites data
BMI rang
Normalweight Overweight Obesity p η2 the role of muscle and fat mass in the expression of explosive power in preschool children 137
N=54 N=5 N=16
CMJ/Hft [m] 0,331 0,030
LJS [m] 0,110 0,068 0,100 0,847 0,005
FATp [%] 1,073 1,120 1,062 0,000 0,590
FATm [kg] 16,87 20,26 27,66 0,000 0,590
MUSCp [%] 3,59 4,66 8,22 0,000 0,249
MUSCm [kg] 77,81 63,10 68,36 0,000 0,266
ExPower [Z-Value] 16,39 17,42 19,69 0,787 0,007
0,038 -0,181 -0,073
CMJ/Hft - counter movement jump/jump height; LJS - long jump from the site; FATp - Fat
percent; FATm - Fat mass; MUSCp – Muscle percent; MUSCm - Muscle mass; ExPower –
average Z-Value of CMJ and LJS test results; p - Sig.; η2 - Eta-squared (ANOVA Effect Size)
The best results on the CMJ height test and in overall explosive power
scores were achieved by children in the Normalweight group, and the best re-
sult on the long jump test was achieved by children of the Overweight group.
Children in the Obesity group achieved the worst result on the long jump test
and in overall explosive power (Table 1). Differences between BMI groups are
not statistically significant (p > 0.05). Eta Squared indicates a medium effect for
the CMJ height (η2 <0.01) and small effect for long jump test and overall explo-
sive power (η2 < 0.01).
Table 2: Correlation of Explosive Power with fat and muscle mass
FATm FATp MUSCm MUSCp
0,065 -0,091
Normal weight (N=54) r 0,030 -0,032 0,640 0,515
0,794 0,185
p 0,832 0,819 0,109 0,766
-0,052 0,079
Overweight (N=5) r 0,609 -0,102 0,849 0,770
p 0,275 0,870
Obesity (N=16) r -0,133 -0,093
p 0,624 0,731
r – Pearson correlation coefficient; p - Sig. (2-tailed)
The results of the research show descriptive data of variables, differences be-
tween BMI groups and the correlation of Explosive Power with fat and mus-
cle mass.
Table 1: Descriptive statistic and ANOVA (according to the BMI rang)
of motor tests results and body composites data
BMI rang
Normalweight Overweight Obesity p η2 the role of muscle and fat mass in the expression of explosive power in preschool children 137
N=54 N=5 N=16
CMJ/Hft [m] 0,331 0,030
LJS [m] 0,110 0,068 0,100 0,847 0,005
FATp [%] 1,073 1,120 1,062 0,000 0,590
FATm [kg] 16,87 20,26 27,66 0,000 0,590
MUSCp [%] 3,59 4,66 8,22 0,000 0,249
MUSCm [kg] 77,81 63,10 68,36 0,000 0,266
ExPower [Z-Value] 16,39 17,42 19,69 0,787 0,007
0,038 -0,181 -0,073
CMJ/Hft - counter movement jump/jump height; LJS - long jump from the site; FATp - Fat
percent; FATm - Fat mass; MUSCp – Muscle percent; MUSCm - Muscle mass; ExPower –
average Z-Value of CMJ and LJS test results; p - Sig.; η2 - Eta-squared (ANOVA Effect Size)
The best results on the CMJ height test and in overall explosive power
scores were achieved by children in the Normalweight group, and the best re-
sult on the long jump test was achieved by children of the Overweight group.
Children in the Obesity group achieved the worst result on the long jump test
and in overall explosive power (Table 1). Differences between BMI groups are
not statistically significant (p > 0.05). Eta Squared indicates a medium effect for
the CMJ height (η2 <0.01) and small effect for long jump test and overall explo-
sive power (η2 < 0.01).
Table 2: Correlation of Explosive Power with fat and muscle mass
FATm FATp MUSCm MUSCp
0,065 -0,091
Normal weight (N=54) r 0,030 -0,032 0,640 0,515
0,794 0,185
p 0,832 0,819 0,109 0,766
-0,052 0,079
Overweight (N=5) r 0,609 -0,102 0,849 0,770
p 0,275 0,870
Obesity (N=16) r -0,133 -0,093
p 0,624 0,731
r – Pearson correlation coefficient; p - Sig. (2-tailed)